- DATE:
- AUTHOR:
- The BigTime Team

March 2023 Product Release Spotlight: Introducing Dashboards
Why We Built It
At BigTime, we understand every professional services organization is unique, with a specific set of goals and challenges. That’s why we designed our dashboards to be highly flexible, allowing you to track the progress of initiatives, teams, and projects that are crucial to your strategic direction.
With BigTime’s dashboards, you have the power to choose the metrics that matter most to you, visualize your data, and arrange the dashboard in a way that brings focus to your KPIs. You can make informed decisions quickly without sifting through irrelevant information to gain a deeper understanding of your business’ health. If you’re looking to better align key metrics with your business strategy, this is where dashboards can help you get on track, and stay on track.
What You Get From Dashboards
See your data and really understand it.
Dashboards complement the reporting you already do, while also translating your key metrics into visual graphs and charts. Research suggests that visualized data can help you connect the dots between data more effectively, leading to better decision-making and improved performance. Additionally, when your data is in one view, you can monitor progress quickly, surface problems faster, and discover new, actionable insights.Share secure, permissioned dashboards with relevant stakeholders.
When you share a dashboard, you can empower teams to own their piece of the business by providing access to meaningful data. Each individual can focus on the measures that align most with their function or goals while helping improve overall business metrics.Stay adaptable with dashboards you can edit.
Remaining flexible as your organization’s strategy changes is critical, especially as your needs, goals, or targets evolve. Whether you’re scaling your operations, want to track more granular KPIs, or need to create an entirely new dashboard, you can rework, rename, re-permission, reorganize, or delete any dashboard at any time. This flexibility helps you to stay nimble and make informed decisions based on your latest data.
How You Could Use Dashboards
The team at BigTime put together some suggestions to help you set up your dashboards effectively. We understand the metrics you track will always depend on your unique business goals. That means it’s crucial to identify how your initiatives contribute to your overall strategy and determine the KPIs that matter most.
Think of a dashboard as a metrics scoreboard to help teams, managers, or executives stay on track and make data-backed decisions. Any BigTime administrator can configure a dashboard to quickly identify areas that require attention.
Here are some examples of dashboard configurations organized by role:
CFOs and Finance or Accounting Managers can have a visual tool to manage, analyze, and monitor A/R metrics from one place. Consider metrics like A/R aging, DSO, top open invoice customers, percent overdue, payment mix, and collections to make sure your A/R strategy is speeding up cash flow.*
*A/R metrics will be available in a future releaseCEOs, Founders, and Owner/Operators can track overall company performance by bringing revenue growth, staffing, and capacity metrics into one view. Consider metrics like total profit, revenue, unbilled WIP, invoice status, firm-wide allocations by month, and firm-wide billability to ensure the business is balancing growth and profitability.
Line of Business VPs, Directors, or General Managers can create dashboards specific to their projects or departments. Consider metrics such as number of active projects, time to approve, underutilized staffers, project budget status (at risk), and unapproved expenses to get a better view of project and/or departmental performance.
Project Managers can identify potential risks to keep any project on track by displaying project status and key milestone metrics. Consider metrics like total overdue tasks, input vs. billable, upcoming projects due, time logged by project, and upcoming tasks by staffer to understand how in-flight projects are progressing.
Resource Managers can track resource utilization across the full project portfolio and identify any bottlenecks or overutilized resources. Consider metrics like role utilization, role billability, underutilized staffers, available capacity of staff, and number of active projects to optimize resource allocation and avoid under or over-utilization.
Operations Managers can keep an eye on operations across the business, from the financial health of the firm to staffing needs, utilization, and even the effectiveness of the collections process. Consider metrics like non-billable charges over time, role utilization, total profit, hours scorecard, total billable charges by project, and unbilled time to identify potential inefficiencies.
You can also set up dashboards by cost center, function, or project to hone in on a specific area of the business.
How It Works
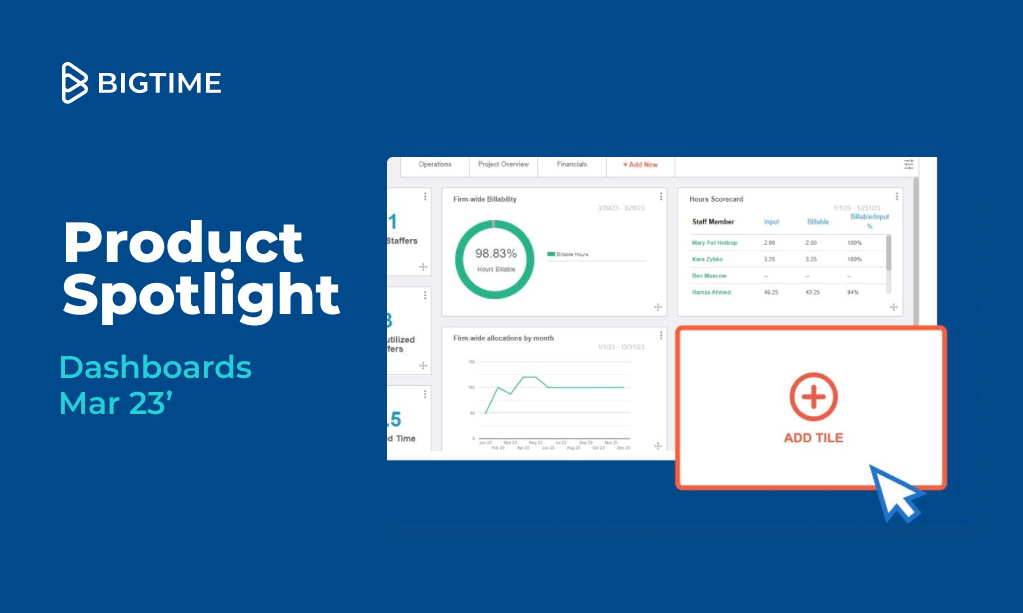
Here’s a sneak peek into dashboards and how they work:
 Find dashboards under the “Analytics” tab
 Add any metrics from the library
 Click into any tile to dig deeper into the data
We can’t wait to see how you use your dashboards to reach your goals and invest in better outcomes. Keep an eye out for new metrics each month to gain more insight into your data.
Want to see how dashboards can work for you?
